Always the Season by Statera Asset Management
Each spring, we hear echoes of a favorite line among many market watchers: the months of May through October
have proved the worst of all in terms of return for U.S. investors, so better to watch out. Perhaps even cut and
run. Among other such compartmentalizations of historical returns, the goal presumably is to show that there
are ways to profitably time exposure to the market. Let it be known that we’ve yet to see such a review
consistent enough to warrant a drift from our long-term approach to investing.
– It’s true that the months of May through October seem to have been less favorable from a total return
standpoint over the years
– The return is still positive, however, just less so than during other months of the year
– The upshot is that remaining invested throughout the year still has proved a more fruitful strategy than
attempting to time market move
Sell in May and Go Away?
It’s a well-worn mantra in stock circles that the months between April and November might best be avoided. And
market history for a time suggested investors might have been better off had they taken heed. But since the close of
World War II, those following the refrain might have been disappointed. Sure, the cumulative long-term returns for
U.S. stocks (as proxied by the S&P 500 Index) from the months that include May through October remain the worst
of any consecutive six-month combination. And six of the ten-worst single-day declines in the S&P 500 have occurred
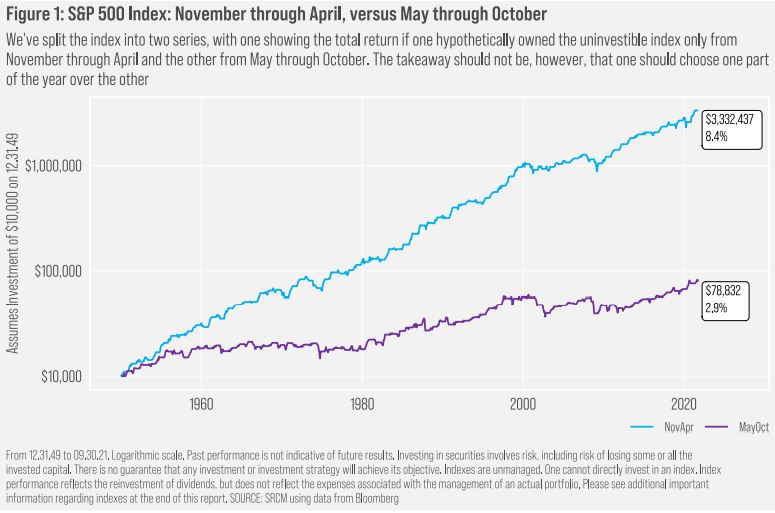
in those months. However, looked at another way, as we do in Figure 1, that returns from May through October are
on average worse than those during the other six months of the year is a fact without much consequence. Who cares
that the returns are lower? They’re still positive.

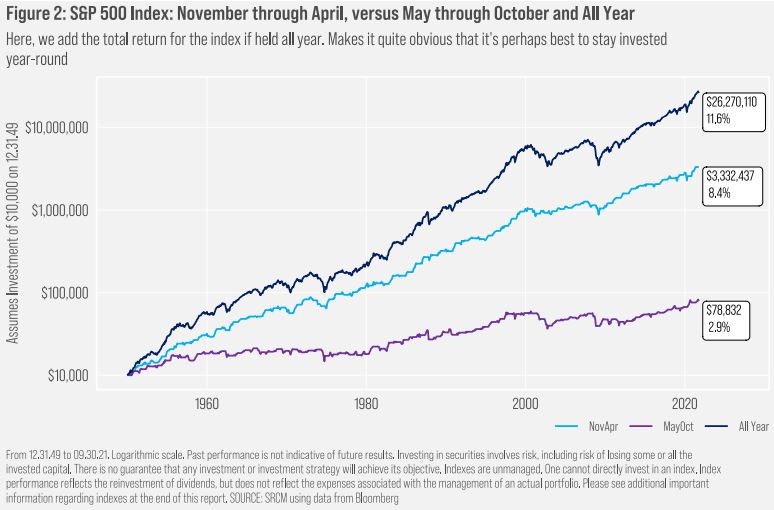
And that means that investors might have been better off by remaining invested throughout the year. And by better off,
we mean substantially so. Thanks to the “miracle of compounding,” even what seems like relatively meager additional
gains of 2.9% per year over the May-October period may have helped to build wealth over time. An investor who sat
tight might have generated a total return of 11.6% per year since the beginning of the 1950s, much better than the
8.4% return generated when one invested in only the “best” six-month period of the year.

Getting the Full Picture
This is another fine example of market legend that potentially leads investors to make poor choices regarding long-term
financial plans. The way the story often is offered, it may leave the impression that returns are negative, on average,
across the May-October period. And folks might react “accordingly”. As we’ve shown, though, returns are meaningfully
positive over those months, too.
Markets have become a good bit more volatile seemingly in light of concerns with regard to global inflation trends,
challenges within China’s real estate sector, politicking over the U.S. national debt, insecurities around energy
availability through the winter, and the stability of the Federal Reserve Board membership. Songs with rhymes like the
one that prompted this note likely will grow louder. But we caution readers that, unless individual financial
circumstances have changed greatly over the medium-term, it’s often been the better course to remain true to an
existing investment plan, rather than joining in with the time-the-market chorus.
Important Information
Statera Asset Management is a dba of Signature Resources Capital Management, LLC (SRCM), which is a Registered Investment Advisor. Registration of
an investment adviser does not imply any specific level of skill or training. The information contained herein has been prepared solely for informational
purposes and is not an offer to buy or sell any security or to participate in any trading strategy. Any decision to utilize the services described herein should
be made after reviewing such definitive investment management agreement and SRCM’s Form ADV Part 2A and 2Bs and conducting such due diligence
as the client deems necessary and consulting the client’s own legal, accounting and tax advisors in order to make an independent determination of the
suitability and consequences of SRCM services. Any portfolio with SRCM involves significant risk, including a complete loss of capital. The applicable
definitive investment management agreement and Form ADV Part 2 contains a more thorough discussion of risk and conflict, which should be carefully
reviewed prior to making any investment decision. Please contact your investment adviser representative to obtain a copy of Form ADV Part 2. All data
presented herein is unaudited, subject to revision by SRCM, and is provided solely as a guide to current expectations.
The opinions expressed herein are those of SRCM as of the date of writing and are subject to change. The material is based on SRCM proprietary research
and analysis of global markets and investing. The information and/or analysis contained in this material have been compiled, or arrived at, from sources
believed to be reliable; however, SRCM does not make any representation as to their accuracy or completeness and does not accept liability for any loss
arising from the use hereof. Some internally generated information may be considered theoretical in nature and is subject to inherent limitations
associated thereby. Any market exposures referenced may or may not be represented in portfolios of clients of SRCM or its affiliates, and do not represent
all securities purchased, sold or recommended for client accounts. The reader should not assume that any investments in market exposures identified
or described were or will be profitable. The information in this material may contain projections or other forward-looking statements regarding future
events, targets or expectations, and are current as of the date indicated. There is no assurance that such events or targets will be achieved. Thus,
potential outcomes may be significantly different. This material is not intended as and should not be used to provide investment advice and is not an
offer to sell a security or a solicitation or an offer, or a recommendation, to buy a security. Investors should consult with an advisor to determine the
appropriate investment vehicle.
The S&P 500 Index measures the performance of the large-cap segment of the U.S. equity market.
The Bloomberg US Aggregate Bond Index is a broad-based flagship benchmark that measures the investment grade, U.S. dollar-denominated, fixed-rate
taxable bond market. The index includes Treasuries, government-related and corporate securities, MBS (agency fixed-rate pass-throughs), ABS and CMBS
(agency and non-agency).
One cannot invest directly in an index. Index performance does not reflect the expenses associated with the management of an actual portfolio.
Investing in any investment vehicle carries risk, including the possible loss of principal, and there can be no assurance that any investment strategy will
provide positive performance over a period of time. The asset classes and/or investment strategies described in this publication may not be suitable for
all investors. Investment decisions should be made based on the investor’s specific financial needs and objectives, goals, time horizon, tax liability and
risk tolerance.
CRN000000-1299090


Recent Comments