10 Things You Should Know About  Sustainable Investing. From HartfordFunds

10 Things You Should Know About Sustainable Investing. From HartfordFunds
10 Things You Should Know About Sustainable Investing. By: Hartford Funds

Sustainable investing is becoming more mainstream. Here are some key things to consider.

Sustainable Investing

  1. Terminologies May Differ – There are many approaches under the sustainable-investing umbrella.
    Examples include socially responsible investing (SRI); environmental, social, and governance (ESG)
    integration; and impact investing. There isn’t currently a uniform definition of these terms and different
    asset managers may define them differently.
  2. Socially Responsible Investing (SRI) or Exclusionary Investing – The modern version of the term SRI has
    its roots in the 1960s and aims to avoid what some consider to be socially “bad” companies (think tobacco
    companies or casinos).
  3. Environmental, Social, and Governance (ESG) – ESG criteria are a way to evaluate how a company behaves.
    For example, environmental standards can measure how a company treats natural resources; social
    standards can evaluate how a company manages relationships with its community; and governance criteria
    can focus on issues such as recruiting women and minorities for the board
  4. ESG in Action – The emphasis placed on ESG criteria varies across funds. Some funds may view ESG factors
    as one consideration among many as they make their investment decisions. Other funds may demonstrate a
    higher level of commitment to ESG investing by making it a key consideration in their investment decisions.
  5. Impact Investing – This strategy generally involves seeking to generate positive, measurable, reportable
    social and/or environmental impact alongside a financial return. For example, an “impact” fund may invest
    in companies that strive to make the world a better place, such as renewable power-generation company, a
    water-treatment facility, or a company that seeks to eradicate a disease.
  6. Performance Matters – Sustainable funds ”comfortably outperformed their peers” in 2020.1 Further
    diminishing lingering assumptions that sustainable investment strategies will underperform, 35% of
    sustainable funds finished in the top quartile of their Morningstar Categories and 66% in the top half.
  7. Not Just for Millennials – Contrary to popular opinion, many investors across all ages feel positively about
    a sustainable portfolio: 44% of people age 71+ as well as 60% of people age 18-37 rated it favorably.
  8. Explosive Growth – Sustainable investing is growing in popularity. During the last decade, it’s become
    a mainstream strategy as opposed to an aspirational concept. In fact, $17.1 trillion was invested in
    sustainable-investing strategies in the US at the beginning of 2020, up 42% from just two years prior.
  9. Something to Talk About – A recent study found the top three issues for asset managers and their
    institutional clients are climate change/carbon, sustainable natural resources/agriculture, and board
    governance.3 Your list may be quite different. Talk to your financial professional about the causes you
    support or issues that concern you.
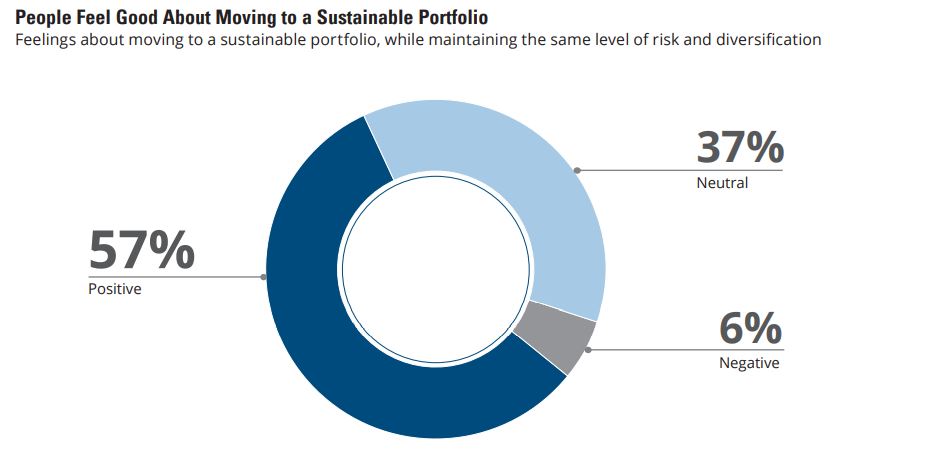
  10. Changing Perceptions – Despite some lingering reservations about sustainable investing, 57% of people
    say they would feel optimistic about incorporating sustainable funds into their portfolio. Many of
    those who felt positively attribute this to the positive environmental impact pursued by some sustainable strategies.
CRN000000-1299090

With Growth and Policy, Which Matters More:  Level or Change? From Hartford Funds

With Growth and Policy, Which Matters More: Level or Change? From Hartford Funds

With Growth and Policy, Which Matters More: Level or Change? Market Update from Hartford Funds

Pandemic risks, persisting inflation pressures, and levels of growth and policy support are driving the economic outlook.

The pandemic’s path remains the key to the economic outlook, and what
we’ve learned about it since last quarter is concerning: Additional variants
are possible (and potentially more transmissible and virulent), vaccine
protection could wane over time, and a significant percentage of the
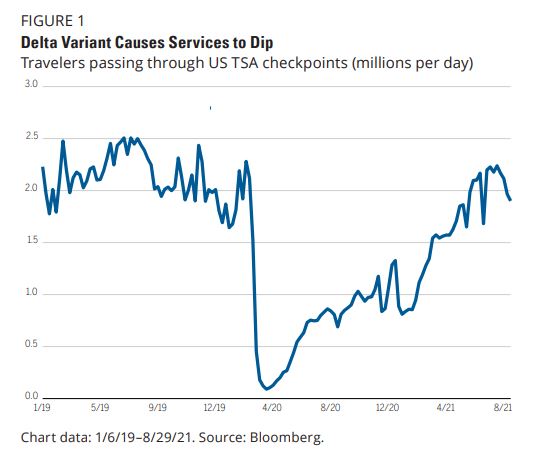
population may remain unvaccinated. This new reality is reflected in reduced
economic activity (FIGURE 1), the resurgence of growth stocks over value
(as measured by Russell 1000 Growth Index1 vs. Russell 1000 Value Index2),
and a return to record lows in long-maturity yields. On a more positive note,
growth is still strong, economies are unlikely to go back into lockdown, and
stimulus remains supportive. All of this leaves markets caught between two
narratives: The pace of growth seems poised to slow, but the level of growth
is likely to remain above par.

Against this backdrop, we continue to seek a pro-risk stance over the next
6−12 months, preferring equities to bonds. But relative to last quarter, our
optimism is tempered somewhat by a slight downgrade to our macro and
policy outlook—including the potential for modestly slower growth, a slight
reduction in policy support, and inflation that’s more persistent than the
market expects. Within equities, we prefer Europe, which we continue to
believe is on the cusp of economic outperformance, and we have reduced
our emerging market (EM) view to neutral given the high costs of COVID19, high inflation,
and political volatility. We remain moderately bearish on
government bonds in Europe in particular, as yields seem too low given our
macro forecast. Credit spreads3 are generally rich, but we find some value in
bank loans and EM debt.

Growth and Policy

We have been advocating value-oriented exposure from a sector, market-cap,
and regional perspective. However, given the slightly less favorable fundamental
and policy backdrop, we think asset allocators should be more balanced between
growth and value. We continue to think commodities are supported by our inflation
outlook, and we favor energy and industrial metals, which have historically been
more sensitive to rising inflation than equities and can potentially help hedge
against a rise in interest rates.

Equities: Optimistic on Europe

We are moderately bullish on European equities due to attractive valuations, the
sharp increase in vaccinations, and high savings levels, which should allow for
more robust spending if consumer confidence increases as we expect. We are also
optimistic that Germany’s elections this fall could lead to a more supportive fiscal
environment and one that may influence the broader European stance. While
Europe has evaded the Delta variant’s wrath better than the US thanks to higher
vaccination rates, we are wary of the variant’s unpredictability and the potential
for further spread on the continent.

We’ve downgraded our view on EM equities to neutral as many countries are
experiencing expanding fiscal deficits and high inflation, and central-bank rate
hikes could slow domestic economies. Pockets of value persist among commodity
exporters and countries less dependent on tourism, but differentiation is key. We
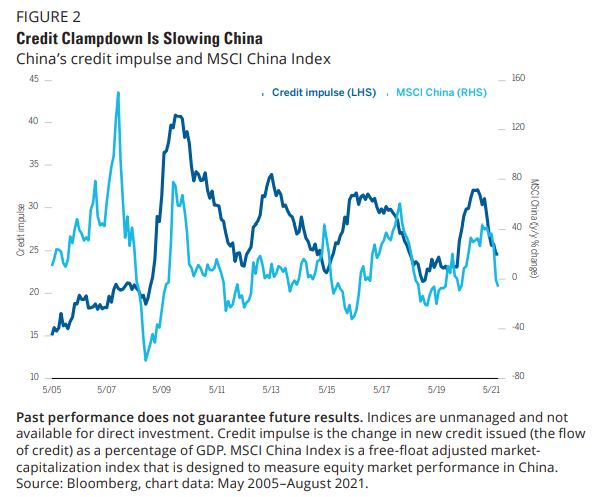
would be selective in China given potential weakness in the cycle and uncertainty
related to the government’s regulatory push and deleveraging in the property
industry (FIGURE 2). Within Asia, we are neutral on Japanese equities. We see
tailwinds from cheap valuations and Prime Minister Suga’s resignation, which should
bode well for the business-friendly Liberal Democratic Party. But we are concerned
about China’s slowdown, which may feed through to the broader region.

Growth and Policy

We maintain a neutral view on the US. We think the US economy will slow somewhat
but stay strong, and consumers are in great shape. While policy support is slowly
declining, it remains highly supportive. Indeed, the Federal Reserve (Fed) seems
convinced that inflation expectations will remain anchored at low levels even as it
keeps its foot on the stimulus pedal. Our view is that inflation could be more
persistent than expected, given challenging supply shortages, rising wages, and
a hot housing market, which tends to lead to sticky shelter inflation. Higher, more
persistent inflation could unsettle equity markets, and valuations are expensive.
Thus, we prefer a quality bias and a balance between growth and value.

Commodities: Strong Fundamentals and a Unique Portfolio Role

We are bullish on commodities given the inflation dynamics discussed, as well
as supply/demand imbalances across energy, metals, and agriculture. Capital
expenditures have been very weak for the past decade following a free-spending
period focused on growth rather than profitability. More structurally, environmental
concerns are feeding into higher costs and potentially lower supply. Our research
shows that commodities have historically been the only asset with a materially
positive beta4 to inflation, so from a portfolio-construction standpoint, we see a
case for at least some commodities exposure.

Low Rates, Tight Spreads: What to Do in Fixed Income?

We agree with market consensus that the Fed may likely begin tapering around
year end. We see the European Central Bank (ECB) as more hawkish relative to the
nominal growth picture in its economy, and we think sovereign rates in Europe are
likely to drift upward. In credit, valuations are rich, with most spreads well inside of
median levels. However, defaults are likely to stay very low, and demand technicals
are strong as demographics and pensions generate huge demand for yield.

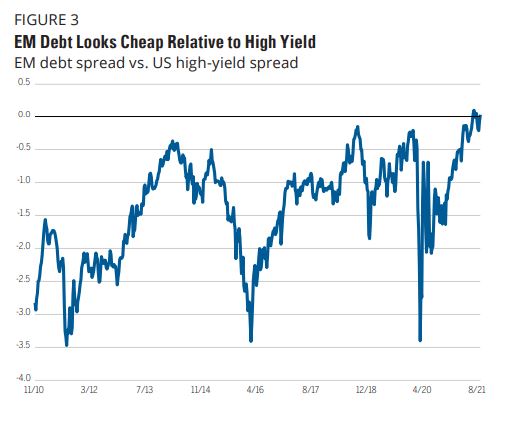
Within credit, we prefer EM debt to US high yield as EM spreads are considerably
wider (FIGURE 3). Credit valuations have been a reliable indicator of forward excess
returns—a dynamic we continue to trust. We think Mexico, Russia, and EM countries
in Central and Eastern Europe are attractive. We also prefer bank loans, which offer
attractive valuations vs. US high yield and could benefit from the Fed beginning to
tighten.

We find securitized credit attractive relative to investment-grade corporates from
a valuation and risk perspective, given the abundance of asset types. We continue
to favor US residential housing, where millennials should be a growing tailwind for
demand. Securitized credit also offers floating-rate structures, which are appealing
from a duration5 perspective. The updated risk factors adopted by the National
Association of Insurance Commissioners may increase demand for AAA- and
AA-rated bonds.

Growth and Policy

Risks

Our base case is that central banks have clearly communicated their intentions to
taper slowly, but a policy mistake remains a risk given the amount of liquidity in
the system and its importance to markets. Bumps could occur if the Fed or ECB are
perceived to be too hawkish, or if their plans don’t change quickly enough in the
face of a new variant or other COVID surprise.

COVID remains the boogeyman. Its impact on consumer preferences (more saving/
less spending) could last longer than expected. And with more than five billion
people unvaccinated worldwide, the potential for new, more dangerous variants
requires investors to stay nimble and monitor portfolio risks carefully.

In addition, China’s opaque system is difficult to analyze, and government priorities
aren’t easy to infer. Although not our base case, China’s renewed focus on
socializing wealth via regulations could continue or even increase. China’s housing
market and debt levels are also concerns, as highlighted by Evergrande’s recent
turmoil.

On the upside, two major market drivers, the Delta variant and China’s regulatory
approach, could both ease in the coming months. EMs could benefit if China’s
policymakers temper their tightening of the property market, boost infrastructure
spending, and loosen climate controls—moves that could be spurred by politics
ahead of the National Congress in November 2022.

Markets may also be positively surprised by the patience of central banks and find
themselves awash in liquidity for several more quarters to come. Interest rates may
stay low for an extended period, despite the economic recovery, and risk assets6
could appreciate further.

Finally, our inflation concerns may be ameliorated by a pickup in productivity,
something that many economic models predict and that could be boosted by
government spending on traditional and technological infrastructure after many
years of underinvestment.

CRN000000-1299090

Getting to Net Zero. From BlackRock

Getting to Net Zero. From BlackRock

Getting to Net Zero by BlackRock

1. What is a net zero economy and why do we need it?

Achieving a net zero economy means drastically reducing emissions by 2050, with the goal of limiting temperature increases to 1.5°C above pre-industrial levels. In order to have a 50% probability of meeting that goal, the world must achieve net zero carbon dioxide emissions by 2050 and net zero emissions of all other greenhouse gases by approximately 2070. Limiting global warming to 1.5°C is the higher aim of the Paris Agreement and is necessary in order to mitigate the most severe long-term economic consequences of climate change. Reaching net zero requires a complete transformation of the global economy. To get there, we need to replace fossil fuels as the economy’s primary energy source, which provide 84% of the world’s energy, with low carbon sources such as wind and solar.

2. What is “temperature alignment?” How do you measure it?

“Temperature alignment” reflects how closely aligned a business, government, or portfolio is to a 2050 net zero economy. Temperature alignment is a forward-looking measurement. In other words, it is measured by looking at emissions today as well as the potential of the emitter to reduce their emissions. In order to measure temperature alignment, one approach is to look at the role a company plays in the economy today and use all available information to assess its expected emissions trajectory out to 2050. We then measure what the world would look like in 2050 if the global economy moved at that same speed to reduce emissions. For example, an oil company today – one that lacks a solid transition plan to net zero – might have a temperature alignment of more than 5ºC. If all companies in the global economy had a similar commitment, we would expect a global temperature rise of more than 5ºC. By contrast, an oil company with a solid transition plan might be measured at 2ºC or below, for the same reasons. This approach helps us provide an alignment measurement for companies of varying sizes. For example, a very small coal mining company or a very large oil producer would both have high temperature alignments. That’s because if the whole energy sector resembled either of those companies in 2050, we would see a significant rise in global temperatures.

3. Why does net zero matter for investors?

Climate risk is investment risk. Companies face two key risks – physical risk and transition risk. As policymakers, regulators, and consumers accelerate the transition to a net zero economy, companies that are not prepared for this transition – i.e., companies that will remain dependent on producing or consuming fossil fuels for too long – risk being left behind by their consumers and shareholders. But the transition to net zero also presents a significant investment opportunity. We believe companies that are best prepared for the transition will provide better long-term returns, as they will be better able to function in an economy that looks vastly different from today’s. We believe that markets are not fully pricing in climate considerations into the value of securities. Investors who factor in transition risks and opportunities will likely benefit from an accelerating reallocation of capital to sustainable companies.

4. What can investors do today to address risks and capture opportunities as the world moves to a net zero economy?

There are several considerations investors can take into account to better align their portfolios with the transition to a net zero economy, and it may take a combination of the below approaches to build an entire portfolio that is progressing toward a net zero-aligned pathway.

1. Holistically address portfolios by replacing core exposures:
Reduce – reduce a portfolio’s exposure to the highest carbon emitters, or companies not taking climate actions based on forward-looking commitments. BlackRock has established a “heightened scrutiny model” for companies that are insufficiently prepared for the net zero transition and have low reception to investment stewardship.
Prioritize – allocate capital based on companies’ actions to transition, such as companies reducing
their reliance on fossil fuels, publishing transition plans and setting science-based targets.

2. Focus on a particular part of the portfolio:
Target – invest in a specific sustainable economic activity, such as clean energy, or investments directly tied to projects that advance environmental purposes, such as green bonds.

3. Integrate data and tools that measure temperature alignment:
Overlay – use latest research and data that measures temperature alignment for issuers and investments. Investors can integrate the temperature alignment data into investment processes alongside traditional financial data.

4. Use votes and engagements to change behavior:
Engage – asset managers can use investment stewardship to ensure companies are mitigating climate risks and considering the opportunities presented by the net zero transition.

CRN000000-1299090

Bonds: There When You Need Them. From Hartford Funds

Bonds: There When You Need Them. From Hartford Funds

Bonds: There When You Need Them by Hartford Funds

With uncertainty on the horizon, talk to your financial professional about investing in fixed income designed to be less sensitive to interest-rate changes

Just booked a long-anticipated vacation? Celebratory dance! Just enrolled in the maintenance plan for your HVAC system? That’s far less exciting. But when your AC quits in a heat wave, you’ll be dancing when the tech shows up for priority service. As investors, sometimes we need a reminder why we enroll in the less flashy stuff, too. While the stock market has soared in 2021, it’s been a tougher ride for fixed-income investors. Interest rates are exceptionally low to help support the economy, and even though rates were expected to go nowhere but up, they defied expectations and dipped even lower for much of the year. With yields (the expected return on a bond) so low and volatility potentially rising, it wouldn’t be surprising if you’ve wondered what bonds have done for you lately. But like signing up for just-in-case maintenance can keep you cool in a pinch, bonds can help us maintain our portfolios’ cool, too. Especially today, when there’s still the threat of volatility and uncertainty from shifting interest rates, it’s important to remember why we bother with bonds in the first place: diversification.*

Team Bonds vs. Team Stocks: It’s Not Really a Competition

There’s a give and take to diversified, balanced portfolios. Sometimes, stocks soar and leave bonds in the dust (ahem, 2021). But other times, stocks are volatile and
bonds provide a welcome degree of stabilization. In other words, if you’re well diversified, one part of your portfolio is likely to
outperform as another underperforms at any given moment. Ultimately, this balance should provide a less volatile experience overall. All the portfolios in FIGURE 1 generated significant positive returns over the time period shown, but the balanced one provided a less turbulent journey.

Unfortunately, there’s no telling which asset class is going to be in favor in any given year. Even the experts who thought rising rates were a no-brainer this year have gotten it wrong lately. That’s why it’s important to work with your financial professional to be prepared for whatever the market throws at you. With continued interest-rate uncertainty on the horizon, here are three strategies to discuss with your financial professional that may better withstand shifting interest rates:

  •   Core-plus funds, which hold a foundation of investment-grade bonds but have the ability to augment that core with other, more opportunistic bonds;
  •    Bank loans, which have variable interest rates that adjust to the market; and
  •    Multi-sector approaches, which have the flexibility to adapt to changing environments.

Whatever you decide, working with professionals who have experience and extensive resources should make it a little easier to sit back and focus on other important things. You know, like putting your feet up in your perfectly climate-controlled home to plan a well-deserved vacation.

Talk to your financial professional about investing in actively managed fixed income that’s designed to be less sensitive to interest-rate changes.

S&P 500 Index is a market capitalization-weighted price index composed of 500 widely held common stocks. Bloomberg US Aggregate Bond Index is composed of securities from
the Bloomberg Barclays Government/Credit Bond Index, Mortgage-Backed Securities Index, Asset-Backed Securities Index, and Commercial Mortgage-Backed Securities Index.
“Bloomberg®” and any Bloomberg Index are service marks of Bloomberg Finance L.P. and its affiliates, including Bloomberg Index Services Limited (“BISL”), the administrator of
the indices (collectively, “Bloomberg”) and have been licensed for use for certain purposes by Hartford Funds. Bloomberg is not affiliated with Hartford Funds, and Bloomberg does
not approve, endorse, review, or recommend any Hartford Funds product. Bloomberg does not guarantee the timeliness, accurateness, or completeness of any data or information
relating to Hartford Fund products.
Important Risks: Investing involves risk, including the possible loss of principal. • Fixed income security risks include credit,
liquidity, call, duration, event and interest-rate risk. As interest rates rise, bond prices generally fall. • Loans can be difficult to
value and less liquid than other types of debt instruments; they are also subject to nonpayment, collateral, bankruptcy, default,
extension, prepayment and insolvency risks.

CRN000000-1299090

Always the Season. From Statera

Always the Season. From Statera

Always the Season by Statera Asset Management

Each spring, we hear echoes of a favorite line among many market watchers: the months of May through October
have proved the worst of all in terms of return for U.S. investors, so better to watch out. Perhaps even cut and
run. Among other such compartmentalizations of historical returns, the goal presumably is to show that there
are ways to profitably time exposure to the market. Let it be known that we’ve yet to see such a review
consistent enough to warrant a drift from our long-term approach to investing.

–   It’s true that the months of May through October seem to have been less favorable from a total return
standpoint over the years
–   The return is still positive, however, just less so than during other months of the year
–   The upshot is that remaining invested throughout the year still has proved a more fruitful strategy than
attempting to time market move

Sell in May and Go Away?

It’s a well-worn mantra in stock circles that the months between April and November might best be avoided. And
market history for a time suggested investors might have been better off had they taken heed. But since the close of
World War II, those following the refrain might have been disappointed. Sure, the cumulative long-term returns for
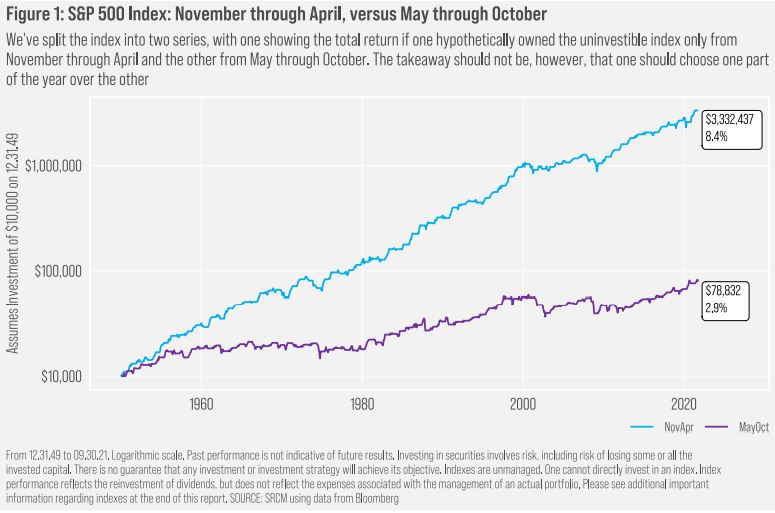
U.S. stocks (as proxied by the S&P 500 Index) from the months that include May through October remain the worst
of any consecutive six-month combination. And six of the ten-worst single-day declines in the S&P 500 have occurred
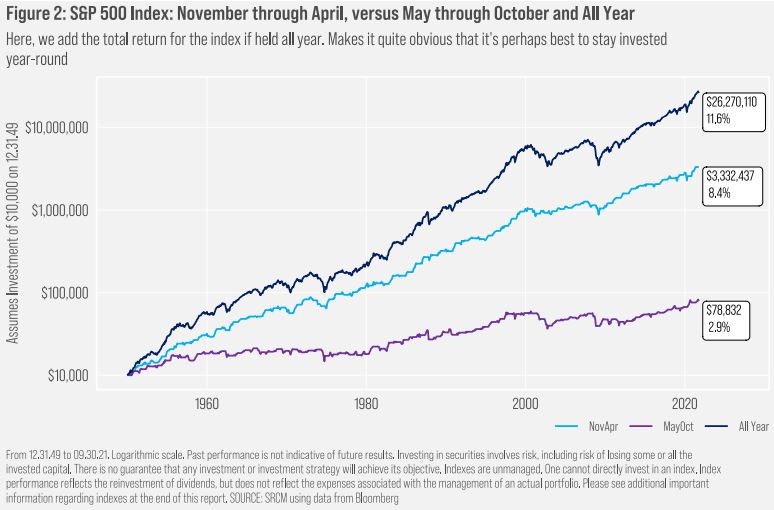
in those months. However, looked at another way, as we do in Figure 1, that returns from May through October are
on average worse than those during the other six months of the year is a fact without much consequence. Who cares
that the returns are lower? They’re still positive.

And that means that investors might have been better off by remaining invested throughout the year. And by better off,
we mean substantially so. Thanks to the “miracle of compounding,” even what seems like relatively meager additional
gains of 2.9% per year over the May-October period may have helped to build wealth over time. An investor who sat
tight might have generated a total return of 11.6% per year since the beginning of the 1950s, much better than the
8.4% return generated when one invested in only the “best” six-month period of the year.

Getting the Full Picture

This is another fine example of market legend that potentially leads investors to make poor choices regarding long-term
financial plans. The way the story often is offered, it may leave the impression that returns are negative, on average,
across the May-October period. And folks might react “accordingly”. As we’ve shown, though, returns are meaningfully
positive over those months, too.

Markets have become a good bit more volatile seemingly in light of concerns with regard to global inflation trends,
challenges within China’s real estate sector, politicking over the U.S. national debt, insecurities around energy
availability through the winter, and the stability of the Federal Reserve Board membership. Songs with rhymes like the
one that prompted this note likely will grow louder. But we caution readers that, unless individual financial
circumstances have changed greatly over the medium-term, it’s often been the better course to remain true to an
existing investment plan, rather than joining in with the time-the-market chorus.

Important Information

Statera Asset Management is a dba of Signature Resources Capital Management, LLC (SRCM), which is a Registered Investment Advisor. Registration of
an investment adviser does not imply any specific level of skill or training. The information contained herein has been prepared solely for informational
purposes and is not an offer to buy or sell any security or to participate in any trading strategy. Any decision to utilize the services described herein should
be made after reviewing such definitive investment management agreement and SRCM’s Form ADV Part 2A and 2Bs and conducting such due diligence
as the client deems necessary and consulting the client’s own legal, accounting and tax advisors in order to make an independent determination of the
suitability and consequences of SRCM services. Any portfolio with SRCM involves significant risk, including a complete loss of capital. The applicable
definitive investment management agreement and Form ADV Part 2 contains a more thorough discussion of risk and conflict, which should be carefully
reviewed prior to making any investment decision. Please contact your investment adviser representative to obtain a copy of Form ADV Part 2. All data
presented herein is unaudited, subject to revision by SRCM, and is provided solely as a guide to current expectations.

The opinions expressed herein are those of SRCM as of the date of writing and are subject to change. The material is based on SRCM proprietary research
and analysis of global markets and investing. The information and/or analysis contained in this material have been compiled, or arrived at, from sources
believed to be reliable; however, SRCM does not make any representation as to their accuracy or completeness and does not accept liability for any loss
arising from the use hereof. Some internally generated information may be considered theoretical in nature and is subject to inherent limitations
associated thereby. Any market exposures referenced may or may not be represented in portfolios of clients of SRCM or its affiliates, and do not represent
all securities purchased, sold or recommended for client accounts. The reader should not assume that any investments in market exposures identified
or described were or will be profitable. The information in this material may contain projections or other forward-looking statements regarding future
events, targets or expectations, and are current as of the date indicated. There is no assurance that such events or targets will be achieved. Thus,
potential outcomes may be significantly different. This material is not intended as and should not be used to provide investment advice and is not an
offer to sell a security or a solicitation or an offer, or a recommendation, to buy a security. Investors should consult with an advisor to determine the
appropriate investment vehicle.

The S&P 500 Index measures the performance of the large-cap segment of the U.S. equity market.

The Bloomberg US Aggregate Bond Index is a broad-based flagship benchmark that measures the investment grade, U.S. dollar-denominated, fixed-rate
taxable bond market. The index includes Treasuries, government-related and corporate securities, MBS (agency fixed-rate pass-throughs), ABS and CMBS
(agency and non-agency).

One cannot invest directly in an index. Index performance does not reflect the expenses associated with the management of an actual portfolio.
Investing in any investment vehicle carries risk, including the possible loss of principal, and there can be no assurance that any investment strategy will
provide positive performance over a period of time. The asset classes and/or investment strategies described in this publication may not be suitable for
all investors. Investment decisions should be made based on the investor’s specific financial needs and objectives, goals, time horizon, tax liability and
risk tolerance.

CRN000000-1299090